The Graph of a Function in 3D
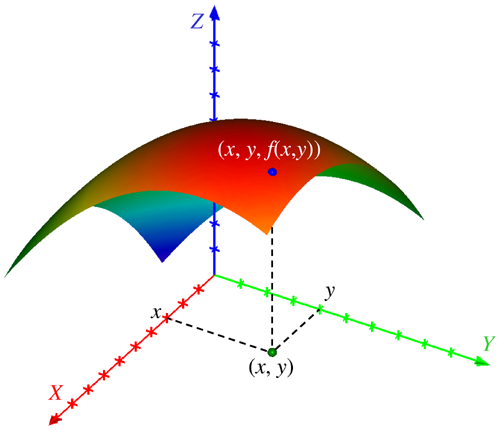
With the graph of a function we mean the graphic that arises when using a real function f of two variables x and y. The graph of a function is the set of points (x, y, f(x,y)) with (x, y) in the domain of the function f. This is illustrated here:
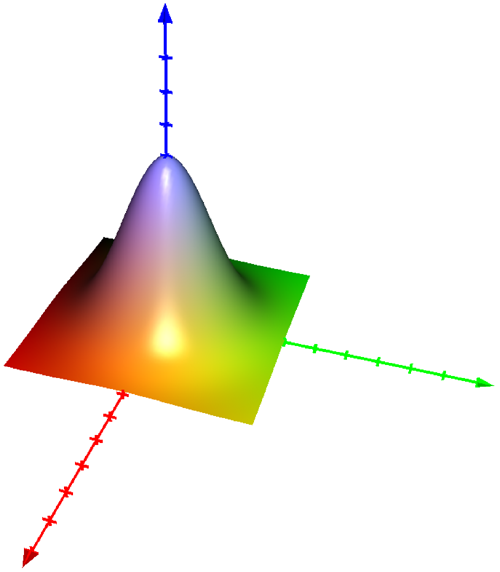
Contrary to the 2-dimensional case, we need to enter the domain on which the graph of the function must be drawn. Here we find for example the graph of f(x,y) = 3*exp(-x^2-y^2), drawn on the domain {(x,y) | -2< x < 2 and -2 < y < 2 }:
To describe a surface this way is easy and can always be used locally as can be shown. It is however not possible to describe a closed surface with one such function. Take for instance a sphere with the origin as center and with radius 1. We know that the equation of this sphere is given by x²+y²+z² = 1. This equation can be rewritten as z² = 1-x²-y². By taking the square root we see that there exist two functions of two variables. One describes the upper half of the sphere and the other one describes the lower half of the sphere. These functions are given by
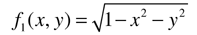
 and are both defined on the domain {(x,y) | x²+y² <= 1}. Using VisuMath, we can illustrate this:
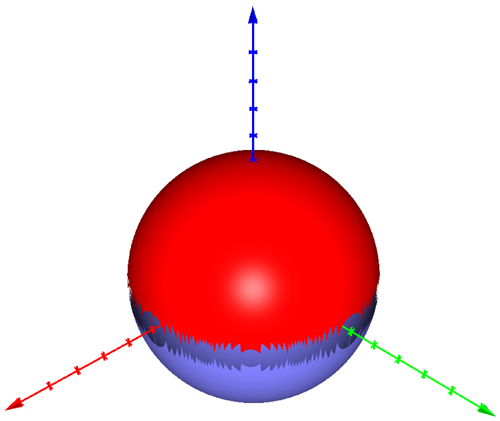 The sphere, however, is not complete at the border because the domain on which the functions are defined is not rectangular. We can improve the result by increasing the accuracy, but at the cost of computing time and memory. Moreover, the gap between the two halves will never vanish completely, unless other ways of representing a sphere are chosen. A parameter equation or spherical coordinates are in this case more appropriate.