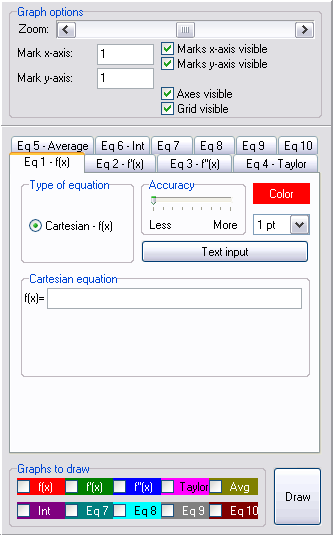
On the left side, we see the window in which all essential information must be filled in. It looks like this:
At most 10 curves can be represented in one graph. Each curve has a corresponding tab page. Tab pages 1 till 6 however have a special function. In tab page 1, only the Cartesian equation of a curve can be entered. Tab pages 2 till 6 are all linked to the first tab page. In these tab pages, no equation can be entered but instead the program itself calculates the requested function. In the case of tab page 2 this is the first derivative and in case of tab page 3 it is the second derivative of the function appearing on tab page 1. On tab page 4, the approximating Taylor polynomial (of maximal order 10) can be computed and visualized. Depending on the given function, the calculation itself may take a while. This is because the calculation of the derivatives is done symbolically first and evaluated afterwards. So, derivatives aren't calculated numerically. On tab page 5, the mean function of the function on tab page 1 is calculated and visualized. The mean value function of a function f has a function value f(x)/x. This function is used frequently in economics. Using tab page 6, one can perform area calculations. Specifically, one can calculate integrals (area) by numerical approximation, calculate under sums, upper sums and Riemann sums and visualize them.
From tab page 7 on, one has the choice between a Cartesian equation, a parameter equation, a polar equation or an implicit equation.
Furthermore, colors, thickness and accuracy (that determines the number of points in between that needs to be computed) can be chosen for each curve.