Central projection corresponds closely to the way we observe objects. This is because the human eye acts like a "camera obscura" and such a camera uses central projection. A typical property of central projection is that parallel straight space lines tend to go through one point, the so called vanishing point.
Parallel projection on the other hand corresponds better to perspective drawings we make ourselves. Indeed, for simplicity we usually draw parallel straight space lines also parallel in projection. Our brain usually doesn't have much trouble in interpreting correctly. The advantage of parallel projection is that parallel pieces of line of equal length also have the same length after projection. This means that graphs based on parallel projection are more appropriate for comparing distances.
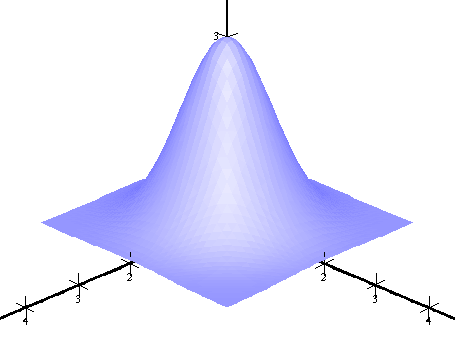
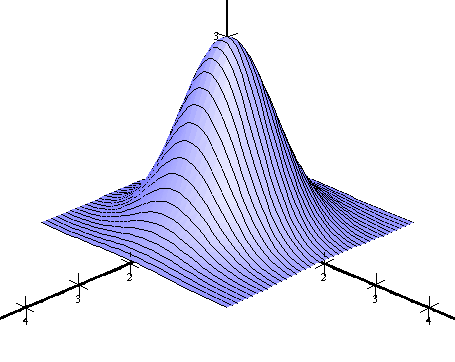
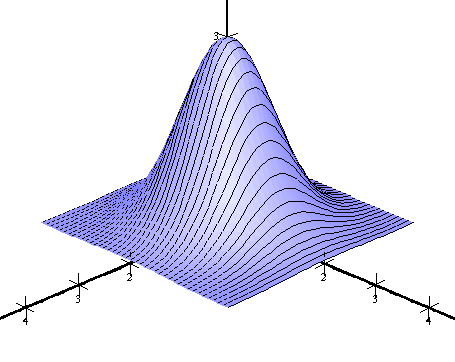
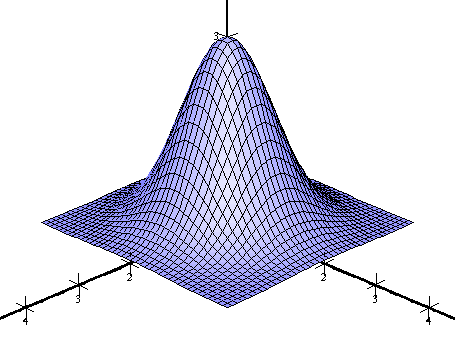
For all types of equations except for implicit equations:
| No lines | Only u-lines |
 |
 |
| Only v-lines | Both u- and v-lines |
 |
 |
| Complete grid | |
 |
|
Only for implicit equations:
|
 |
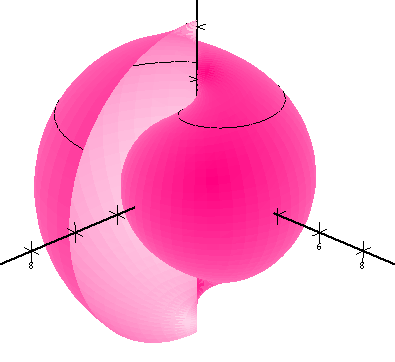
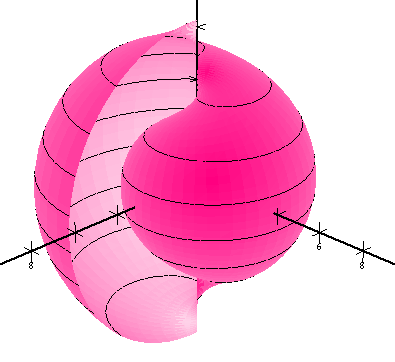
Level curves can be drawn for all types of equations, at least when “preview” is unchecked. A level curve is a curve on the surface that lies on a fixed constant height. So a level curve is the intersection of the surface with a horizontal plane. VisuMath can draw the level curve that corresponds to a certain height or one can enter the number of level curves that must be drawn between the minimal and the maximal function value. In the latter, VisuMath divides the range between the minimal and the maximal function value into equal parts. Here we see an example of the two possibilities. The one level curve that is visible is situated on level z=3.
 |
 |
Also the coloring scheme can be chosen. For this, there are four possibilities:
- Color according to the angle of the normal. This coloring scheme is based on the selected color and gives a realistic representation of the surface using shadow and lighting. When the two sides of a surface are visible, the one part will be more dark than the other. Consequently, one can distinguish the inner part better from the outer part. Here we see an example:

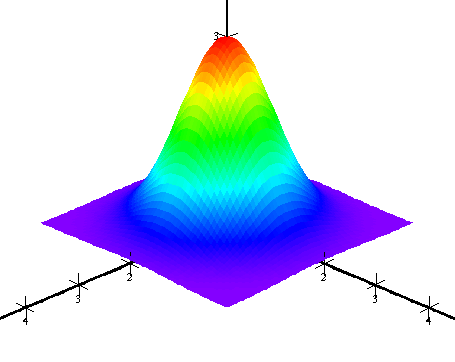
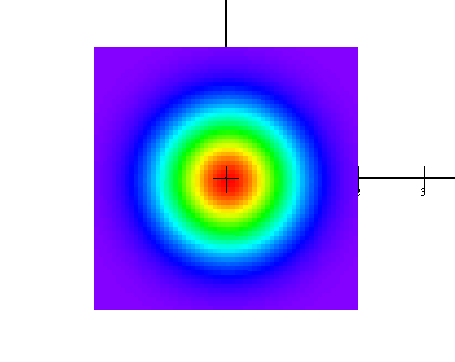
- Color according to the height. The color will now vary between red for the highest points and violet/blue for the lowest points. This option is interesting in combination with the option of level curves. Switch for instance to parallel projection, color according to height and choose a number of level curves. Now, when looking to the surface from above, you will get a colored height map of the surface. Below, we see a side view as well as a height map:
 |
 |
- Color according to height and angle of the normal. This option combines the former options. This means that the color still contains height information but that also shadow/lighting is applied. When two sides of the surface are visible, the one side will be darker than the other side. As a consequence, the inner part for instance can be distinguished more easily from the outer part. Here is an example:
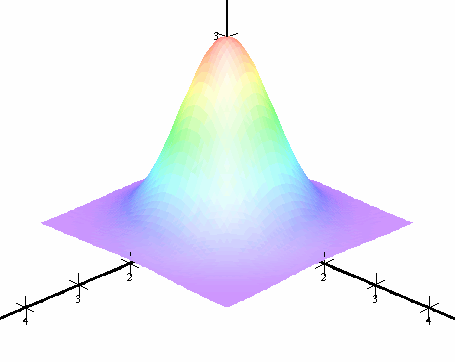
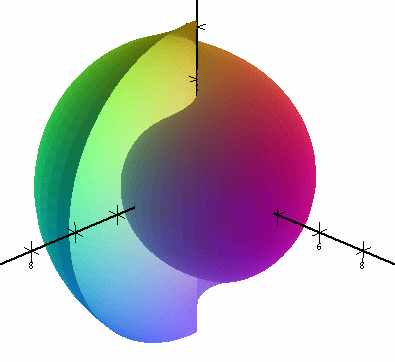
- Color according to red, green and blue values. With this option, every point is colored with a color that originates from optical mixing of the colors red, green and blue. The amount of red, resp. green and blue is determined by the x-, resp. y- and z-coordinate of the point. Below is an example:
The option “Flip normal” alters the “lighting”. Dark areas become light and vice versa. With this option, some parts of the graph can be made more clear.